There are technical weaknesses in Subramanian’s claim of 4.5% growth
Last week, former Chief Economic Adviser Arvind Subramanian claimed in an Indian Express column (bit.do/ eVn2A), based on his new research paper, that GDP growth in 2011-16 was only 4.5%, not 7% as officially claimed. He felt the new methodology for calculating GDP post-2011had exaggerated true growth.
In a column in the Sunday Times of India (bit.do/eVn3K), I had said GDP data may fail the ‘smell test’ of being in sync with other economic indicators. But so did Subramanian’s estimate of 3.5-5.5%, with a mid-point of 4.5%. He called 4.5% a ‘solid growth rate’, whereas almost all analysts would call it disastrous, much too bad to be credible.
<Slow Coach?
Subramanian examines 17 indicators, including electricity, oil, exports, imports, cement, bank credit and rail freight. For 15 of the 17 items, growth after 2011 was slower than before, often dramatically slower. This, he says, is not consistent with the official estimate of 6.9% growth after 2011, only slightly lower than 7.5% before 2011.
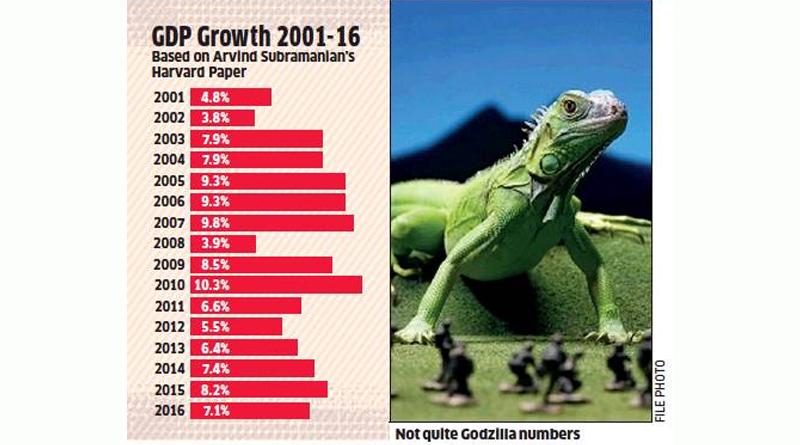
The years covered by Subramanian’s research start from 2001 (a global recession year) and include 2002 (which had the worst drought for decades). Instead, let us start from 2003 and calculate the GDP growth rate till 2010. This gives a pre-2011rate of 8.4%. After 2011, the rate fell to 6.9%. This big slowdown can explain the fall in Subramanian’s 17 indicators, without any need to blame this on data fudging. Besides, of the 17 indicators, petroleum and electricity consumption accelerated after 2011, as did tax revenues. Is this consistent with a crash in GDP growth to 4.5%? Hardly.
Next Subramanian looks at four indicators: credit, exports, imports and electricity. He models a relationship between these four indicators and GDP growth for a sample of 71countries. He finds that India conforms to the trend line for the 71 countries till 2011, but then diverges sharply. From this divergence, he estimates that the post-2011 growth rate has been overestimated by 2.5%. That is how he concludes that the actual rate is not the official 7% but 4.5%.
For countries with dubious data like China, analysts have often used a similar technique of estimating growth from lead economic indicators. But this yields only an educated guesstimate, not an accurate count at all. Subramanian’s exercise suggests there are flaws in official GDP, but he cannot present his guesstimate as an authoritative figure.
Besides, his four indicators may be misleading, not enlightening, because enormous changes have occurred in the Indian and world economy after the 2008 financial crisis. Surjit Bhalla in an Indian Express column (bit.do/ eVn7K) notes that world trade fell off a cliff in 2012. Between 2001 and 2011, world exports had double-digit growth (in US dollars), but this collapsed to –1.5% per year in 2012-16. In real terms, world export growth fell from 4.6% to –1%. In sum, global growth acquired a new shape delinked from exports, no less than in India.
Before the financial crisis, bank credit, private investment and exports spearheaded a massive boom. But after 2008, the main drivers of growth changed to massive monetary stimulus by central banks plus a substantial fiscal stimulus. Public investment and consumption became more important drivers than private investment. Corporate funding now came mainly not from bank credit but bonds, commercial paper and equity markets.
Economists like Poonam Gupta have remarked on the de-leveraging and ‘credit-less recovery’ in many countries; India is not alone. Gupta suggests we could choose the financial crisis of 2008 rather than 2011 as the inflection point. That also yields a picture of ultra-fast growth (pre-2008) followed by a distinct slowdown (2009-16).
Revealing Evidence
So, we can explain anomalies in economic indicators by structural changes in the global economy induced by the financial crisis, rather than faulty GDP methodology. Had GDP growth really fallen to 4.5%, corporate profits should have shattered, causing a mass exit of foreign portfolio investment. The very opposite has happened.
Many global investment bankers place India’s potential growth rate at over 8%. Subramanian’s own Economic Survey of 2015-16 said India’s growth potential was 8-10%. If India is actually growing at 4.5% — just half its potential — surely that would show up in massive excess capacity and industrial closures. Those disasters have not happened.
In 2011, most villages lacked roads, electricity and telecom. Today, these three have reached all but the remotest villages. They are new drivers of rural growth. The National Bank for Agriculture and Rural Development (Nabard) says only 23% of rural income now comes from crops and animal husbandry.
Again, the spread of roads has facilitated a huge expansion of internal trade between states, something Subramanian himself researched in the past. Indian states are as big as most countries. So, trade between states may yield the kind of gains yielded only by international trade for small countries like the Asian tigers. Maybe India can now grow fast without the exportdependence exhibited by others.
In sum, many possible explanations exist for the puzzles and anomalies in the economy. Data problems are only one explanation. Subramanian makes a good case for re-examining how we measure industrial output. This gets obscured by his unjustified claim that GDP growth has collapsed to 4.5%