India is rich in dubious data. A good example is the Household Consumption Expenditure Survey, 2022-23. Its reams of data have been analysed threadbare, yet the analyses are necessarily as flawed as the data.
Economist Surjit Bhalla has used the data to calculate that extreme poverty (defined as those living on $1.9/day at purchasing power parity) has crashed from 12.2% in 2011-12 to just 2% of the population. He also calculates that inequality (measured by the Gini coefficient) has fallen from 28.7 to 27 in rural areas and from 36.7 to 31.9 in urban areas. Does one cheer or sneer?
Major problem: those surveyed have no incentives to tell the truth and many to fib. For this very reason, election opinion polls and exit polls go terribly wrong despite pollsters spending large sums on sophisticated statistical techniques. Voters have strong incentives (including self-protection) to lie and none to be truthful.
Three things follow from GOI’s latest GDP figures
My nephew once worked with a rural NGO. I asked him whether villagers would tell the truth about their economic conditions. He replied, “If asked by fellow villagers, they will exaggerate to impress. If asked by outsiders, they will claim to be in deep distress, just in case that qualifies them for some freebie.” As freebies have proliferated, so have incentives to fib. Our statistical systems depend too much on self-reported data. This flawed methodology is being overhauled in other major economies. India must follow suit.
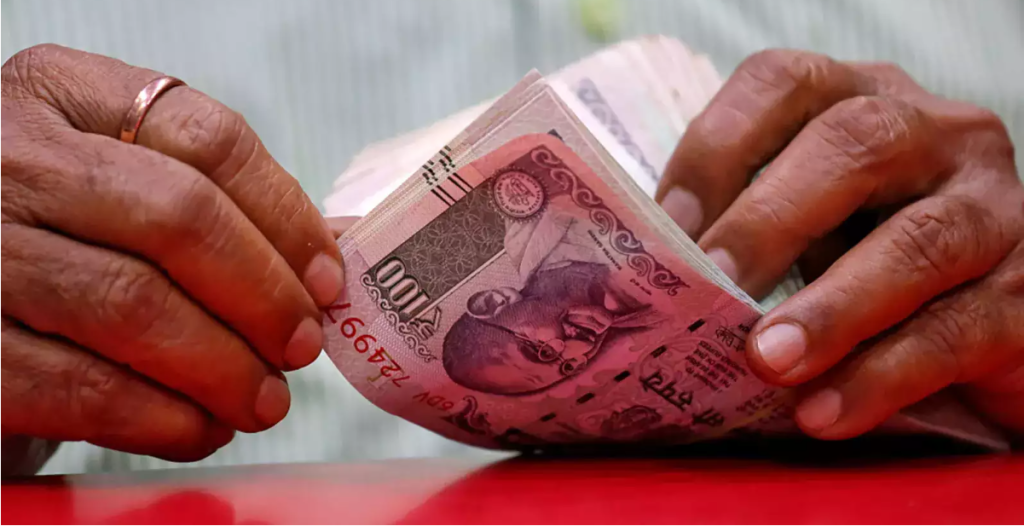
According to the latest survey, the richest 5% in rural areas spend just Rs 10,501 per month. Anybody familiar with the lifestyles of rich farmers — who own fancy cars and palatial bungalows — will laugh.
Cat out of the bag: The urban rich go shopping in London and skiing in Switzerland but the survey numbers don’t reflect these spends
Worse, the 5% richest in urban areas—including the likes of Ambani and Adani — supposedly spend just Rs 20,821 per month! That’s crazy. The urban rich go to London for weekend shopping and to Switzerland for winter skiing. They spend millions per painting at art auctions. Survey questionnaires are not designed to capture such expenditures. Most rich folk refuse to be interviewed, and the rest are economical with the truth.
The survey claims that rent accounts for only 0.78% of rural spending and 6.56% of urban spending. This will astonish couples who spend half their income on rent. Explanation? Most urban and almost all rural folk live in self-owned houses and pay no rent. In advanced countries, the imputed rental value of self-occupied homes is added, putting owners and renters on a level field. This is not done in India, and so greatly understates the real consumption of homeowners.
While accepting that surveys grossly underestimate the spending of the rich, Indian statisticians have assumed that the non-rich mainly tell the truth. Sorry, but they too have every incentive to understate. The problem is compounded by technical flaws like the omission of imputed rent in self-occupied homes.
Some economists argue that while absolute numbers for consumption may be under-reported, trends in consumption over time may be accurate. This will be so if the extent of under-reportage remains constant over time. In fact, proliferating freebies keep increasing the incentive to under-report. In consequence, overall consumption in surveys has been getting more flawed over time. Consumption estimated in the latest survey is less than half that recorded by GDP data. The gap is much smaller in major economies. But even there, economists acknowledge that self-reported data is unreliable, and so are seeking ways to fix the problem.
What expenditure survey says about inequality in India
In a 2017 study Fox, Heggeness, Pacas and Stevens found that in four US states, at least 40% of recipients of food stamps denied getting any. Meyer, Mok and Sullivan bluntly titled their 2015 study ‘Household Surveys in Crisis’. They found that welfare recipients in surveys declared barely half what they got through food stamps, welfare cash transfers and workers’ compensation. Trudi Renwick says non-response to US census questions on income rose from 28% in 1997 to 45% in 2015. Non-response was highest among the richest and poorest, so data on both are seriously flawed.
The way forward, say US economists, is to create models on spending in which survey data are mixed with ‘administrative data’—that is data from sales, tax receipts, goods movement and other relevant sources. These get closer to the truth. They have shortcomings, no doubt, yet are better than the plain rubbish in unmodified surveys.
Let us return to the question posed earlier in this column. Do we cheer or sneer at Bhalla’s conclusion that the latest survey implies a fall in extreme poverty to 2% and a sharp reduction of inequality? Given chronic under-reporting by the poor, extreme poverty must be even less than 2%, and that merits a cheer. But when estimates for both the rich and poor are so flawed, Bhalla’s sheer guesstimates of inequality trends merit neither cheer nor sneer. But maybe a snigger?